PU Prime App
Exclusive deals on mobile


PU Prime App
Exclusive deals on mobile
Hold The Global Markets In Your Hands
Our trading mobile app is compatible with most smart devices. Download the App now and start trading with PU Prime on any device, anytime and anywhere.


23 May 2024,04:58
Daily Market Analysis
23 May 2024, 04:58


Asian equity markets opened strongly at the start of the week, buoyed by the bullish sentiment from last Friday’s U.S. market performance. Investors in the U.S. are eyeing Nvidia’s earnings report on Wednesday, anticipating another AI-driven rally.
On the other hand, geopolitical issues in Eastern Europe and the Middle East have intensified, driving safe-haven gold prices to all-time high levels. Oil prices also recorded marginal gains at the beginning of the week due to supply disruptions following a reported drone attack on a Russian oil refinery.
In the forex market, the Reserve Bank of Australia’s meeting minutes are due tomorrow, potentially impacting the Australian dollar. The Reserve Bank of New Zealand’s interest rate decision is scheduled for Wednesday, with the country’s 4% inflation rate suggesting a continuation of monetary tightening. Additionally, the UK’s CPI will be unveiled on the same day, providing Pound traders with critical data to gauge the strength of Sterling.
Current rate hike bets on 12nd June Fed interest rate decision:
Source: CME Fedwatch Tool
0 bps (91.1%) VS -25 bps (8.9%)
Market Overview

(MT4 System Time)

Source: MQL5
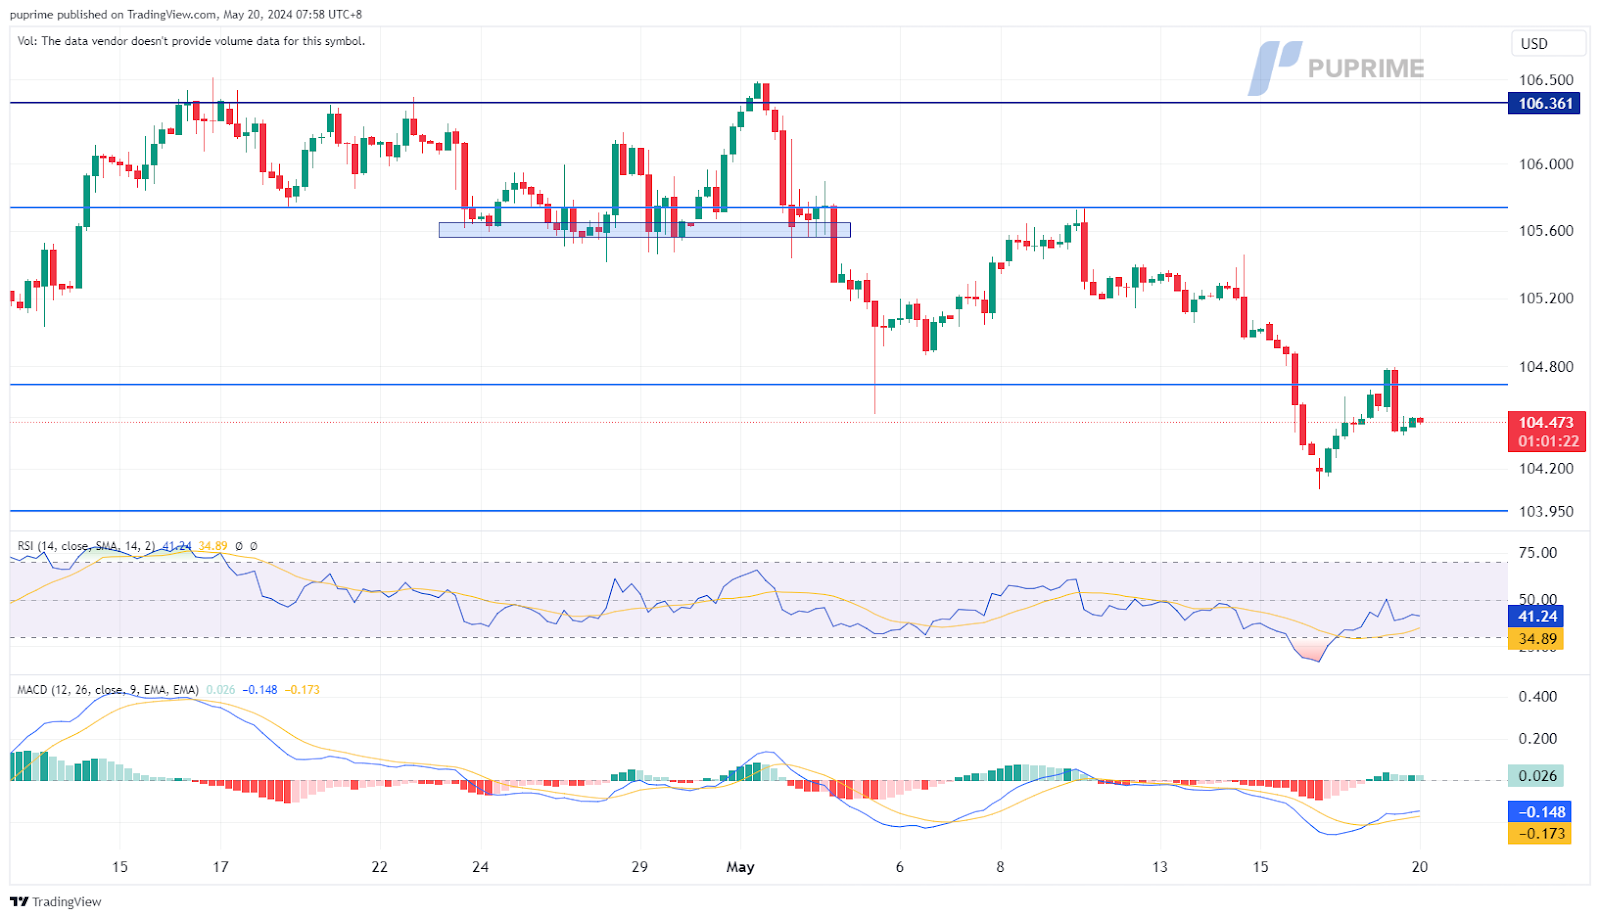
The US Dollar Index (DXY) remains under significant selling pressure, currently trading below the key 105 level. This weakness persists despite a recent rebound attempt following a period of sharp decline. The primary driver behind the dollar’s woes is the release of US inflation data, which hinted at a potential peak in inflation. This positive development has fueled market optimism for a more dovish Federal Reserve policy, potentially including rate cuts later in the year.
The Dollar Index recorded a technical rebound but remains trading with its bearish trajectory. The RSI has gotten out from the oversold zone but remains below the 50 level, while the MACD has crossed below the zero line, suggesting the bearish momentum has eased.
Resistance level: 104.70, 105.80
Support level: 103.95 103.15
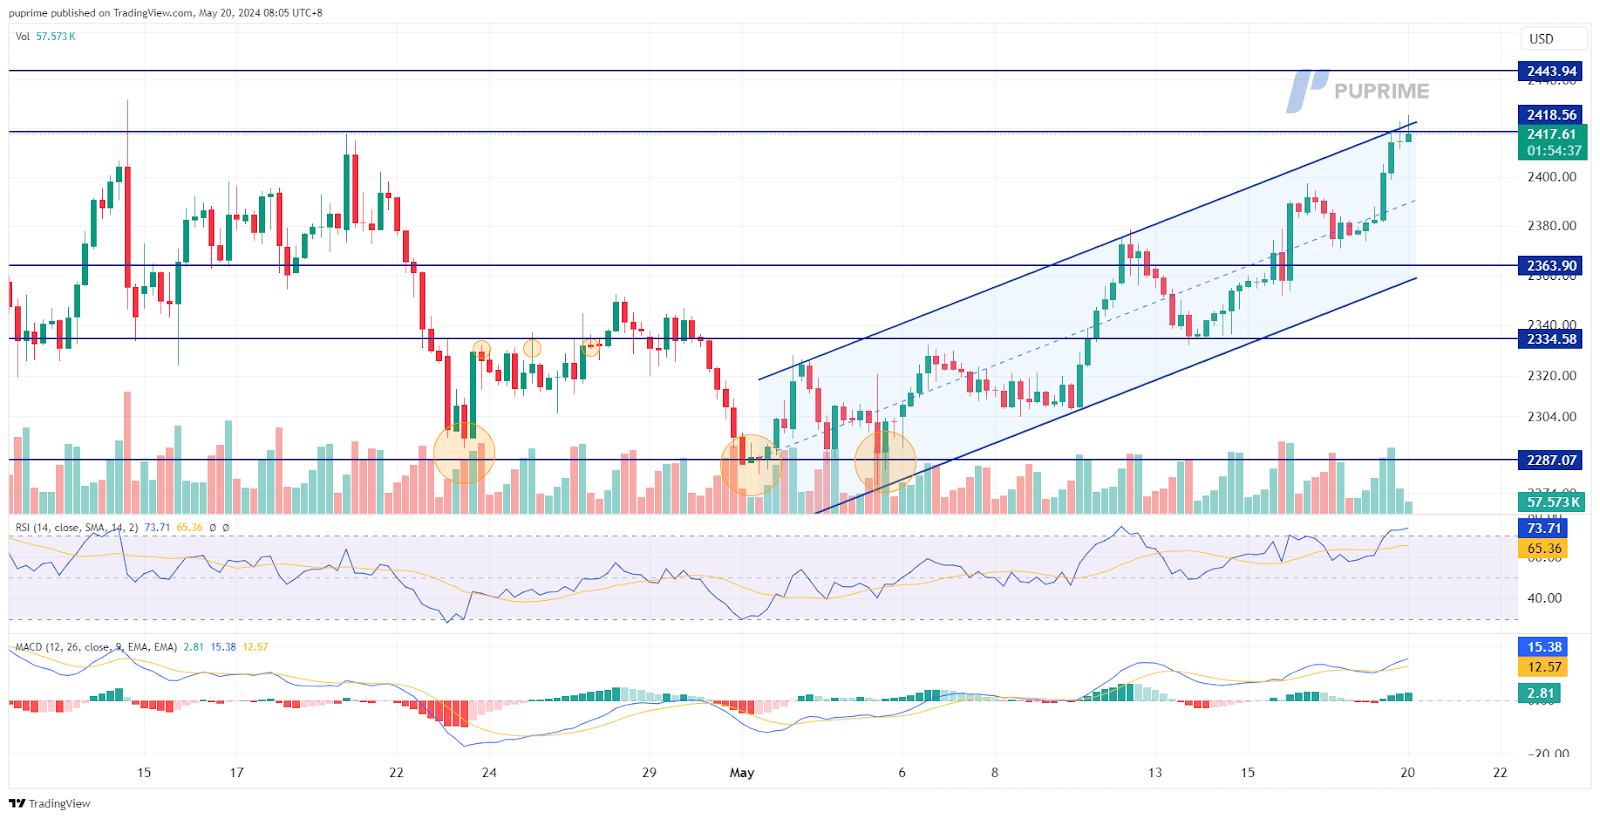
Gold prices are trading strongly towards their all-time high of $2,431.80, remaining within their uptrend channel and suggesting a bullish bias for the safe-haven asset. The softening dollar and the prospect of a monetary policy shift by the Federal Reserve this year buoy the precious metal. Additionally, intensified tensions in Eastern Europe and the Middle East have further supported the upward momentum for gold.
Gold prices have once again traded back to its all time high territories suggest a bullish bias for the gold. The RSI has broken into the overbought zone while the MACD continues to edge higher, suggesting the bullish momentum remain strong.
Resistance level: 2418.50, 2443.95
Support level: 2364.00, 2335.00
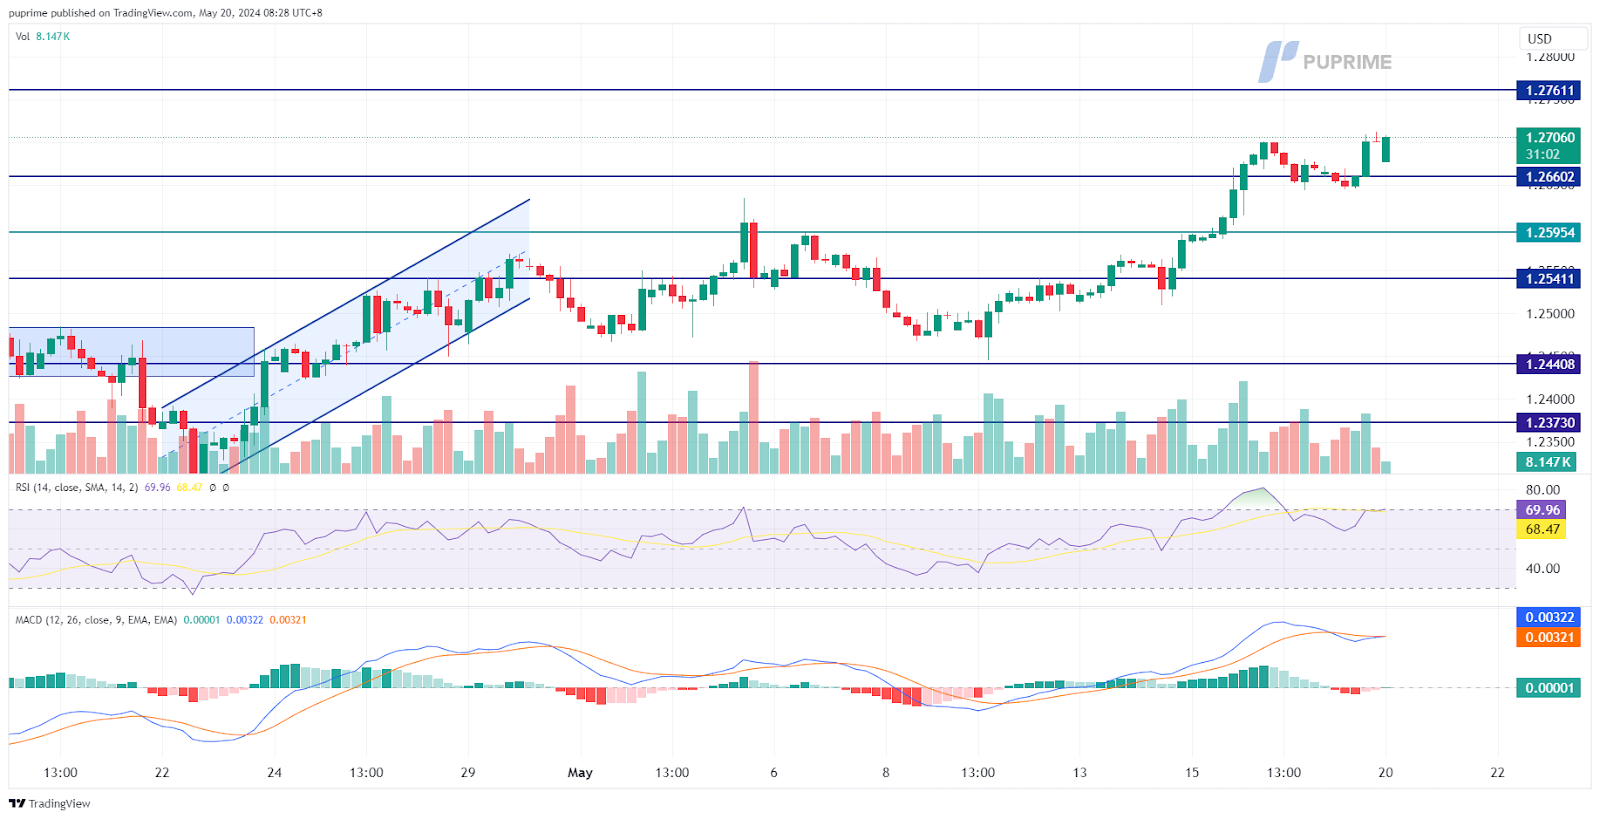
The GBP/USD pair traded toward its two-month high but has formed an evening star pattern, suggesting a potential trend reversal. Sterling is poised for significant economic data releases, with traders closely watching Wednesday’s CPI report to gauge the currency’s strength.
GBP/USD is currently trading in the narrow range at its 2-month high levels. The RSI remains closely toward the overbought zone while the MACD edges lower and crosses on the above, suggesting the bullish momentum is easing.
Resistance level: 1.2760, 1.2850
Support level: 1.2660, 1.2600
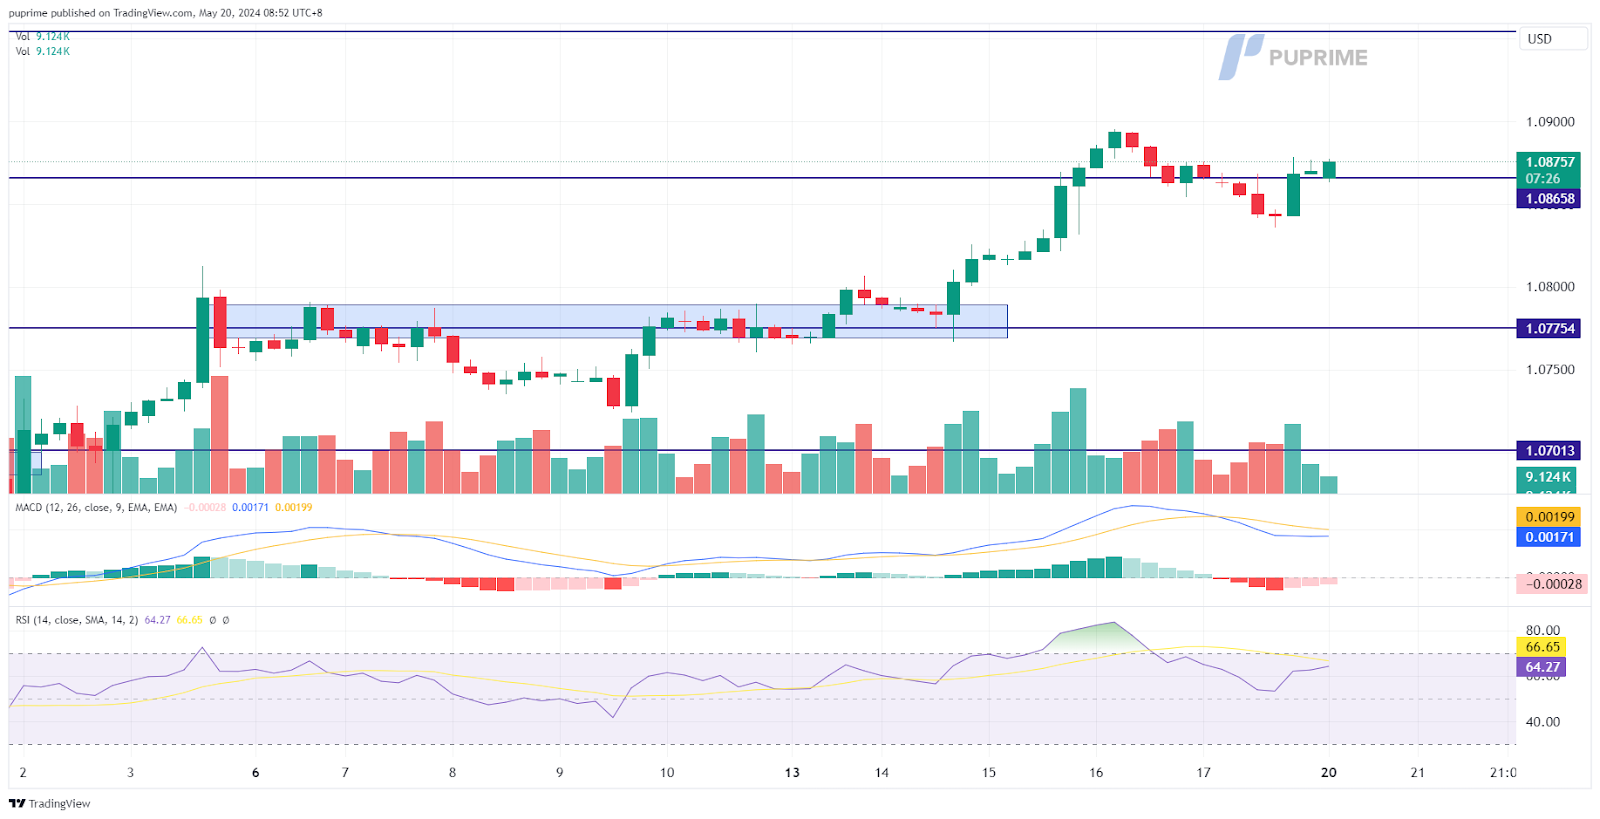
The EUR/USD pair has formed a morning star candlestick pattern at elevated levels, suggesting continued bullish momentum. The pair may capitalise on the softening U.S. dollar and trade towards its next psychological resistance level at 1.0900. Meanwhile, euro traders are eyeing tomorrow’s speech by ECB Chair Christine Lagarde for insights into the ECB’s upcoming monetary policy moves.
The pair remains trading at its 2-month high levels awaiting for the catalyst to break higher. The MACD is hovering at elevated levels while the RSI is flowing near the overbought zone, suggesting the bullish momentum remains intact with the pair.
Resistance level:1.0940, 1.1040
Support level: 1.0775, 1.0700
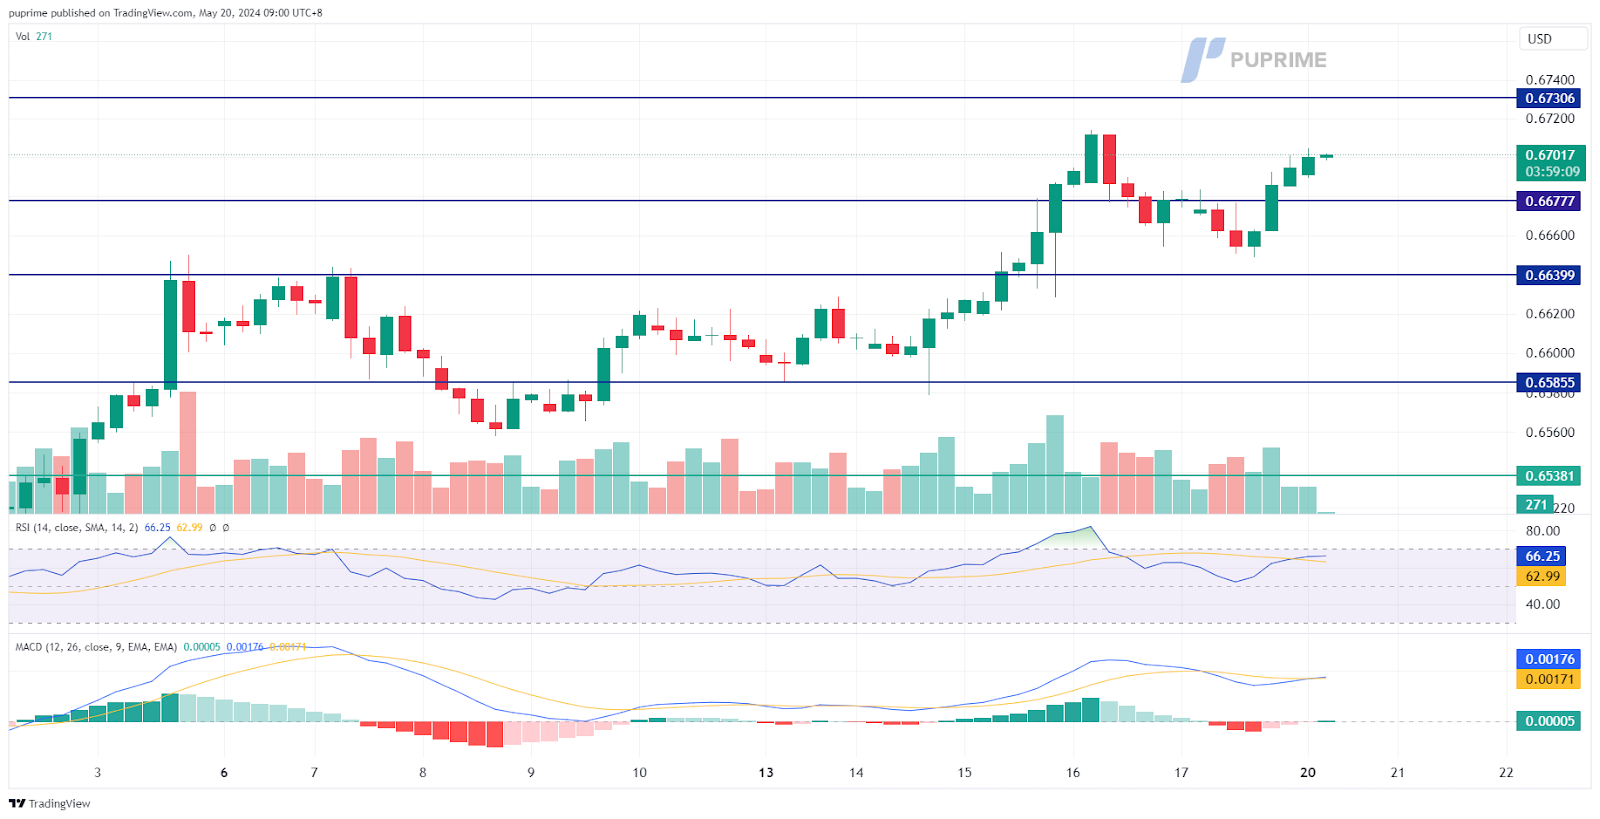
The AUD/USD pair is climbing back towards its previous high near 0.6710 as the U.S. dollar continues to lack bullish momentum. The Aussie dollar is buoyed by expectations of a relatively hawkish monetary policy from the RBA, given the country’s persistently high inflation. However, the latest unemployment rate has climbed to 4.1%, which may hinder the Aussie’s strength. Traders will closely monitor Tuesday’s RBA meeting minutes to gauge the direction of upcoming monetary policy moves and their implications for the Aussie dollar.
The pair is climbing toward its recent high level while the bullish momentum remains intact. The RSI flows closely to the overbought zone, while the MACD hovers flat at the elevated levels.
Resistance level: 0.6730, 0.6790
Support level: 0.6680, 0.6640
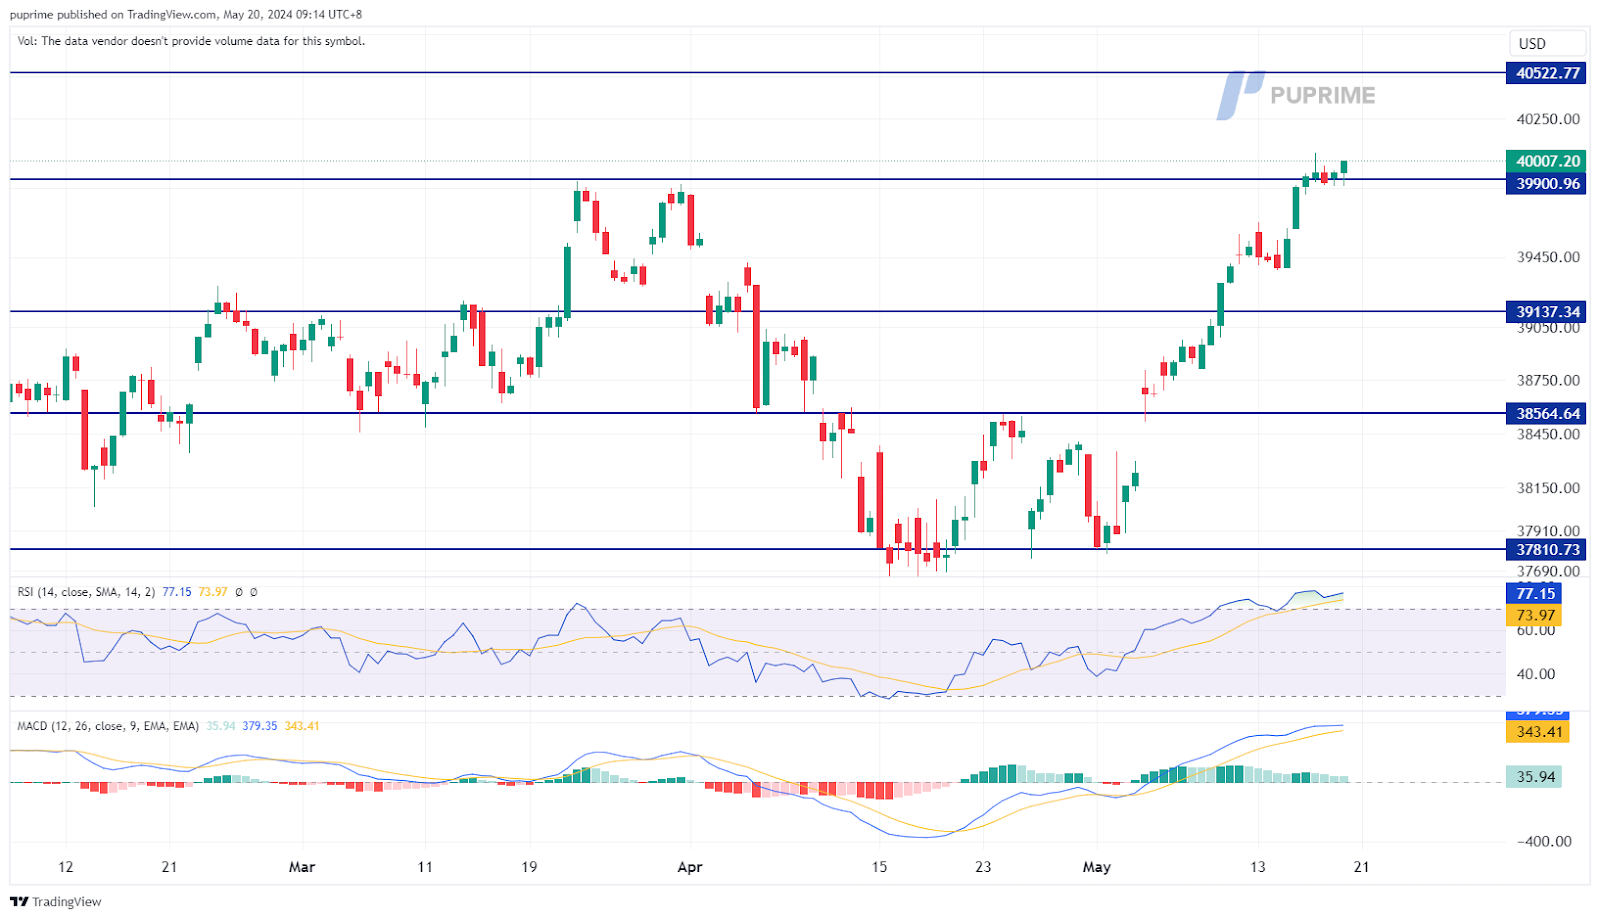
The Dow is surging nearly 6% in May and decisively breaching the key psychological resistance level of 40,000. This strong bullish momentum suggests a continued upward trend for the index. Investors are increasingly confident that the Fed will adopt a more dovish monetary policy stance in response to recent signs of easing inflation. The prospect of lower interest rates is a major boon for equities. Secondly, anticipation is building for the upcoming earnings report from tech giant Nvidia, scheduled for Wednesday. A positive report could further propel the market upward.
The index has been trading with extremely bullish momentum in May, and the bullish signal remains, especially after the index broke above its key resistance level at the 40,000 mark. The RSI remains in the overbought zone, while the MACD continues to edge higher, suggesting that the bullish momentum remains strong.
Resistance level: 40520.00, 41300.00
Support level: 39140.00, 38565.00
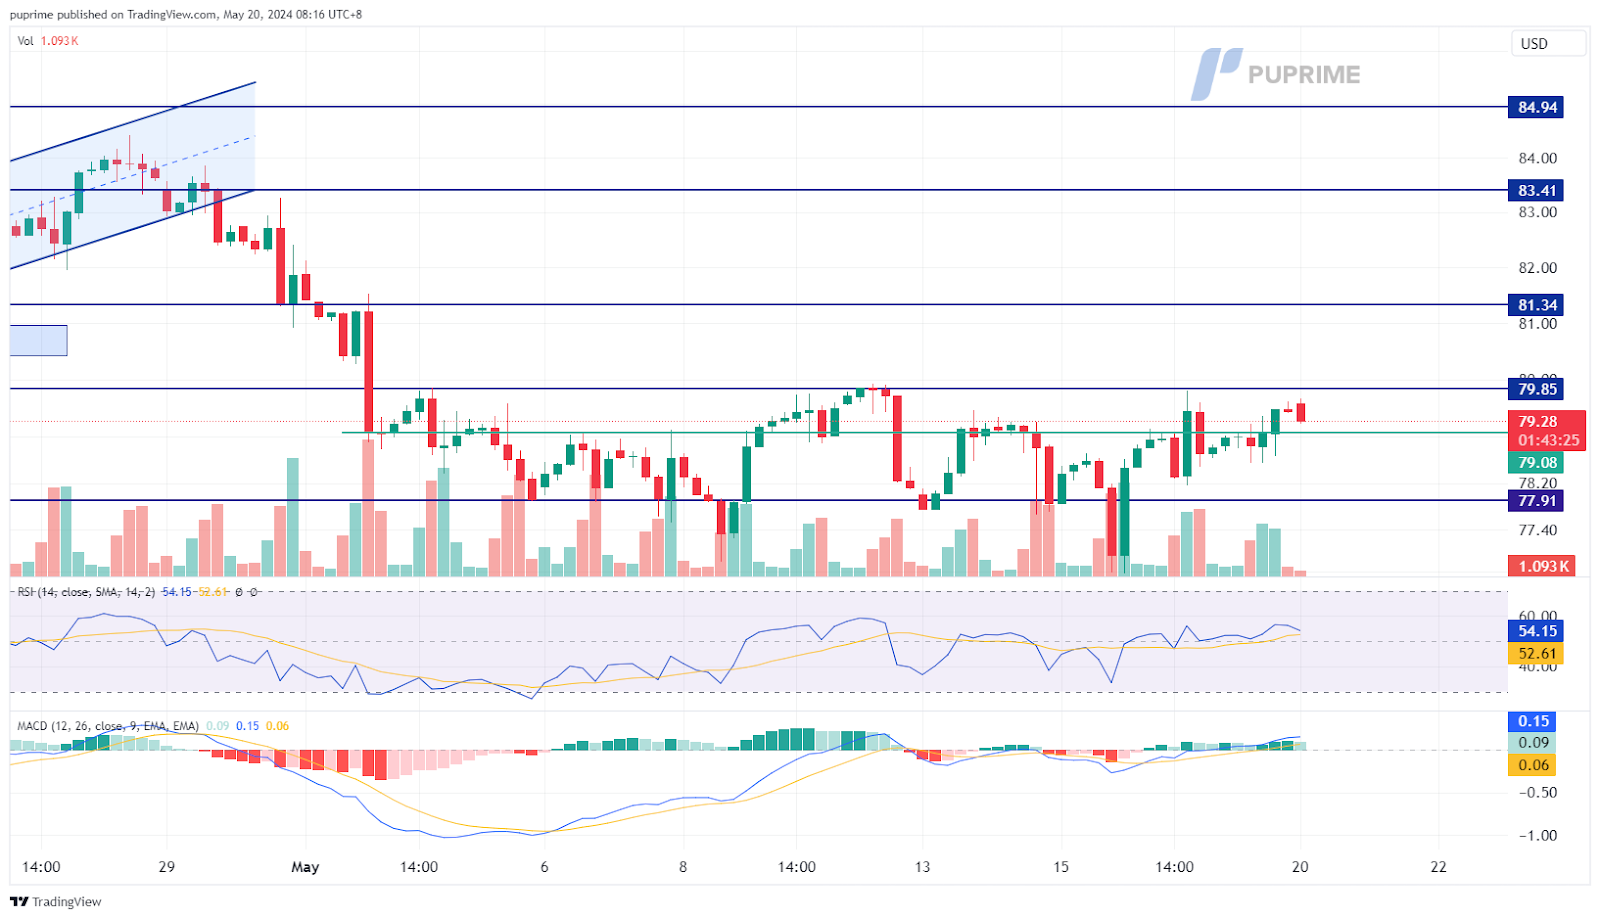
Oil prices continue to trade in a sideways manner, fluctuating between $77 and $80 per barrel. Recent geopolitical developments in the Middle East and Europe could act as catalysts for oil prices as tensions intensify. Notably, a Russian oil refinery was hit, potentially causing a short-term supply disruption in the market.
Oil prices are trading sideways, awaiting a break above their psychological resistance level at $80. The RSI is gradually moving upward, while the MACD has broken above the zero line, suggesting a fresh bullish momentum may be forming.
Resistance level: 79.85, 81.35
Support level: 77.90, 75.95

Trade forex, indices, metal, and more at industry-low spreads and lightning-fast execution.
Sign up for a PU Prime Live Account with our hassle-free process.
Effortlessly fund your account with a wide range of channels and accepted currencies.
Access hundreds of instruments under market-leading trading conditions.
PU Prime App - Start Trading with an Edge


Risk Warning: Contracts for Difference (CFDs) trading carries a high level of risk to your capital and can result in losses, you should only trade with money you can afford to lose. CFDs trading may not be suitable for all investors, please ensure that you fully understand the risks involved and take appropriate measures to manage them. Please read the relevant Risk Disclosure document carefully, available here: Legal Documentation.
PU Prime is a business name of PU Prime LLC. PU Prime LLC is registered in St. Vincent and the Grenadines with registration number: 271 LLC 2020, registered office at 1 Floor, First St Vincent Bank Building, James Street, Kingstown, St. Vincent and the Grenadines.
The information on this website is not directed to residents of certain jurisdictions such as the United States, Singapore, Australia, China, and some other regions, and is not intended for distribution to, or use by, any person in any countries or jurisdictions where such distribution or use would be contrary to local law or regulation.
Copyright © 2024 PU Prime.

